
Published by the Research and Training Center on Community Living, Institute on Community Integration (UCEDD) • College of Education and Human Development, University of Minnesota
Volume 17 • Number 1 • February 2006
Family Support Service in the United States
This Policy Research Brief provides an overview of family support services in the states based on data gathered for the State of the States in Developmental Disabilities Project, a longitudinal study of public financial and programmatic trends in intellectual or developmental disabilities (ID/DD) conducted by the University of Colorado Department of Psychiatry and the Coleman Institute for Cognitive Disabilities, University of Colorado, Boulder. The brief was authored by Mary Rizzolo, Associate Director, Institute on Disability and Human Development, University of Illinois at Chicago; Richard Hemp, Senior Professional Research Assistant, State of the States in Developmental Disabilities Project, University of Colorado School of Medicine, Department of Psychiatry, Boulder; and David Braddock, Executive Director, Coleman Institute for Cognitive Disabilities, and Coleman-Turner Chair and Professor in Psychiatry, University of Colorado School of Medicine, Boulder. Dr. Rizzolo may be reached at 312/413-8833 or mrizzo3@uic.edu. Mr. Hemp may be reached at 303/735-0252 or rick.hemp@cu.edu. Dr. Braddock may be reached at 303/492-0639 or braddock@cu.edu. The State of the States in Developmental Disabilities Project is funded in part as a Data Collection Project of National Significance by the Administration on Developmental Disabilities, U.S. Department on Health and Human Services, grant #90DN0183/02; by the Department of Psychiatry of the University of Colorado School of Medicine; and by the Coleman Institute for Cognitive Disabilities.
Introduction
Family support for families of children with disabilities consists of a range of services or supports including direct cash payments to families, vouchers, reimbursement, or direct payments to service providers that help families keep their children at home. Some of the services a state may offer include respite care, family counseling, future planning, architectural adaptation of the home, in-home training, sibling support programs, education and behavior management services, and the purchase of specialized equipment. The goal of family support programs is to assist families in coping with the stress associated with caregiving while helping them build upon existing strengths and resources. Family support programs endeavor to keep families from being forced to place their relatives in out-of-home residential settings.
For most of American history, families have assumed the responsibility of caring for their relatives who are elderly or have disabilities (Rothman, 1971). Family support finally emerged as a significant priority for intellectual or developmental disability (ID/DD) state agencies in the early 1980s (Agosta & Bradley, 1985; Fujiura, Garza, & Braddock, 1990; Turnbull & Turnbull, 2000), albeit at levels of funding that have lagged substantially behind the funding level for out-of-home residential care.
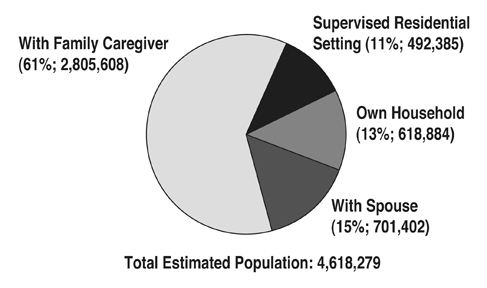
An estimated 4.6 million Americans have an intellectual or developmental disability (Larson, Lakin, Anderson, Kwak, Lee, & Anderson, 2000) and approximately 61% of these individuals receive residential care from family caregivers (see Figure 1). An additional 15% live with a spouse, 13% live in their own home, and 11% live in “supervised residential settings” (Braddock, Hemp, Rizzolo, Coulter, Haffer, & Thompson, 2005; Fujiura, 1998). Supervised residential settings include public and private institutions, nursing facilities, group homes, apartments, foster care placements, and supported living/personal assistance settings (Braddock et al., 2005).
| Figure 1: United States: Distribution of Individuals with MR/DD by Living Arrangement, 2004 | ||||||
 |
||||||
Source: From The State of the States in Developmental Disabilities, by D. Braddock et al., 2005, Boulder, CO: Coleman Institute for Cognitive Disabilities and Department of Psychiatry, University of Colorado. Based on Fujiura (1998). |
||||||
Family support programs have historically been centered around public and private service agencies. However, consumer, family, and advocate demand for more consumer-directed services has resulted in the establishment of cash subsidy programs in 22 states. Research on consumer and family-directed supports indicates that increased control over respite and personal care services can result in numerous benefits including reduced stress (Herman, 1991; Meyers & Marcenko, 1989; Zimmermann, 1984), reduced financial worries (Herman, 1991), increased self-efficacy (Heller, Miller, & Hsieh, 1999; Zimmerman, 1984), increased satisfaction with services (Caldwell & Heller, 2003), decreased need for out-of-home placement (Heller et al., 1999; Meyers & Marcenko, 1989), and increased maternal employment (Caldwell & Heller, 2003).
Certainly studies have demonstrated the cost effectiveness of family support programs to states. Nevertheless, families incur additional costs than those reimbursed by formal programs. Fujiura, Roccoforte, and Braddock (1994) estimated that families spent an additional $6,300 per year (in 1990 dollars) on out-of-pocket expenses for their adult child with a developmental disability. Similar results were reported by Birenbaum et al. (1990), and Lewis and Johnson (2005) discussed the shift in “financial burden from taxpayers to the families themselves” (p. 85). Despite potential individual and family hardships, most individuals with disabilities wish to remain at home – a desire shared by their families (Johnson, Kastner, and the Committee on Children with Disabilities, 2005). The availability of external supports has been shown to increase families’ willingness and ability to keep their children at home (Birenbaum, Guyot, & Cohen, 1990; Cole & Meyer, 1989; Fujiura, et al. 1994).
This brief reports on data on the levels of family support spending and the numbers of families supported in each state and the District of Columbia. The following questions are addressed:
- To what extent have the states directed long-term care financial resources to family support?
- To what extent have the states used HCBS Waiver funding for family support?
- To what extent were states providing direct cash payments (i.e., cash subsidies) to families in 2004?
- What was the proportion of families with children receiving support in each state?
Method
Family support data were collected during the most recent 2003-04 extension of the ongoing State of the States study (Braddock et al., 2005). Family support data were a subset of all data collected for the study. Project staff developed a set of three Exceltm data collection worksheets, particularized to each state, and including the 2001-02 data collected from the state in the previous study (Braddock, Hemp, & Rizzolo, 2004; Rizzolo, Hemp, & Braddock, 2004). The worksheets contained empty cells for the data requested from the state for 2003-04. Project staff obtained the requested data from one or more state budget/program staff identified by the state ID/DD agency director, from state budget documents, and from secondary federal data sources. Upon receipt of the data, project staff returned to the state a draft series of charts and tables depicting spending, revenue and participant trends in the state, including trends in family support. The state data contacts were asked to review the data for accuracy and to make any necessary additions or revisions. (A more detailed discussion of the study’s methodology is provided in Braddock et al., 2005.)
Findings
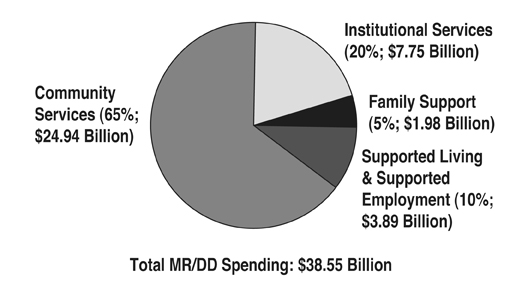
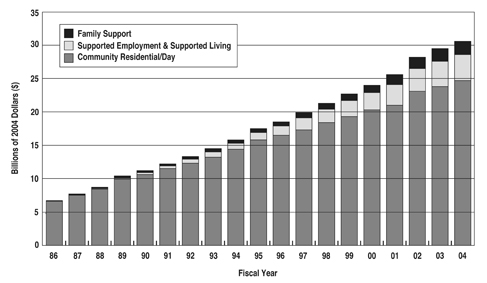
The majority of long-term care for persons with ID/DD is provided in family homes, but only a fraction of public long-term spending has been directed towards family care (Braddock et al., 2005). In 2004, $1.98 billion, or 6% of community developmental disabilities funding (5% of total ID/DD spending) was allocated to family support services across the nation (see Figure 2). Since 1986, family support spending has been outpaced by consolidated spending for supported employment and supported living (see Figure 3).
Family support spending in FY 2004 increased 16% in real economic terms over the FY 2002 spending level. All 50 states reported a family support initiative in either cash subsidy or other family support activity (the District of Columbia did not fund family support services). However, there was tremendous variability across the states in family support spending levels. Twenty-one states increased both inflation-adjusted family support spending and the number of families supported during 2002-04 (Arizona, California, Connecticut, Florida, Georgia, Hawaii, Indiana, Iowa, Louisiana, Maine, Maryland, Mississippi, Nevada, New Jersey, New Mexico, North Dakota, South Carolina, South Dakota, Washington, West Virginia, and Wisconsin). Six states increased family support spending yet decreased the number of families supported (Illinois, Missouri, Montana, Nebraska, Pennsylvania, and Wyoming). Eight states reduced spending levels while increasing the number of families supported (Arkansas, Delaware, Massachusetts, Minnesota, Ohio, Oklahoma, Rhode Island, and Vermont), and 14 states decreased both family support spending and the number of families supported (Alaska, Colorado, Idaho, Kansas, Kentucky, Michigan, New Hampshire, New York, North Carolina, Oregon, Tennessee, Texas, Utah, and Virginia). Alabama decreased spending, while supporting the same number of families (see Table 1).
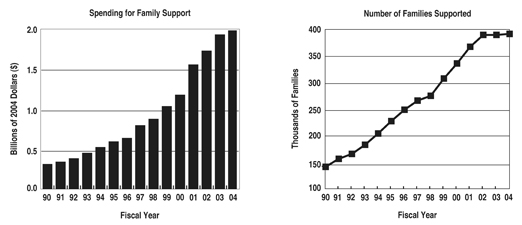
Figure 4 illustrates the growth in family support spending across the U.S. during 1990-2004. In 2004, 395,978 families received family support services, an increase of only 2,249 families from the number supported in 2002. This was the lowest rate of increase in families supported for any two-year period since we began collecting family support data in 1986 (Braddock, Hemp, Fujiura, Bachelder, & Mitchell, 1990). In 2004, the average spending per family across the states was $5,005, ranging from $235 per year per family in Alabama to over $10,000 in nine states (see Table 1).
Cash Subsidy
In 2004, 22 states financed cash subsidy programs (see Table 2) totaling $95.1 million in cash payments to 33,334 families. The State of the States in Developmental Disabilities Project first collected cash subsidy payments in 1986. Cash subsidy funding that year totaled $9.3 million in seven states (Florida, Louisiana, Michigan, Minnesota, Nevada, North Dakota, and South Carolina). The number of states providing cash subsidies increased steadily to 19 in 1992, declined to 17 in 1993, and ranged from 19 to 22 states during 1994-04. Cash subsidy spending increased 5% in 2002-04; however, there was a 2% spending decline from 2003-04. This was the first adjusted spending reduction in cash subsidy payments since the project began collecting data in 1986.
The average annual subsidy payment to a family in the U.S. in 2004 was $2,853. Payments ranged from $567 in Utah to $11,739 in Illinois. The combined cash subsidy programs in Illinois, Michigan, New Jersey, Texas, and Louisiana accounted for 66% of all subsidy payments in the U.S. during 2004. The number of families receiving cash subsidies in participating states varied greatly. Delaware, New Mexico, North Dakota, and Rhode Island each subsidized fewer than 100 families, while Michigan and New Jersey each provided subsidies to more than 6,000 families (see Table 2).
Eight states, including Washington State which initiated cash subsidies in 2003, increased both cash subsidy spending and families supported during 2002-04 (Connecticut, Delaware, Kansas, Michigan, Nevada, New Jersey, New Mexico, and Washington). Three states increased cash subsidy spending but reduced the number of families supported (Arizona, Florida, and Illinois). Five states reduced cash subsidy spending but increased the number of families supported (Arkansas, Louisiana, Minnesota, Oklahoma, and South Carolina) and five states reduced both cash subsidy spending and the number of families supported (Alaska, North Dakota, Rhode Island, Texas, and Utah). Missouri discontinued its cash subsidy programs in 2003 and Iowa had no growth (0%) in both cash subsidy spending and in the number of families supported.
The HCBS Waiver
The federal government requires that all states provide certain “mandatory” services through their Medicaid plans including inpatient hospital; outpatient hospital; Early and Periodic Screening; Diagnosis; and Treatment (EPSDT); and some nursing facility services. There are numerous “optional” services that a state may choose to provide in its state plan, including six that are critically important to individuals with developmental disabilities – two health care services (clinic and rehabilitative services), one institutional long-term care service (ICF/MR), and three community-based long-term care services (HCBS Waiver, personal assistance services, and targeted case management) (Braddock, 2002). These optional Medicaid services constituted 78% of the $38.55 billion in total ID/DD long-term care spending in the United States in 2004 (Braddock et al., 2005).
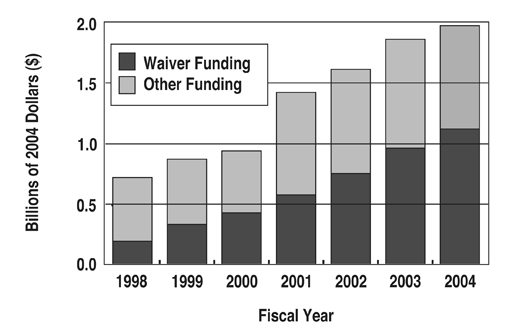
The Medicaid Home and Community Based Services (HCBS) Waiver (P.L. 97-35), enacted in 1981, has been instrumental in helping states reduce their reliance on institutional settings while developing community service programs. Some of the HCBS Waiver services a state may offer include case management, homemaker assistance, home health aides, personal care, residential and day habilitation, transportation, supported employment, home modification, occupational, speech, physical, and behavioral therapy, and family support and respite care. In 2004, the HCBS Waiver financed 57% of all family support services in the U.S. – more than double the proportion funded by the Waiver in 1998 (see Figure 5). States varied greatly in the extent to which they utilized HCBS Waiver dollars to finance their family support initiatives. Seventeen states opted to finance their family support initiatives solely through state funding. Conversely, 13 states funded 90% or more of their family support system with the Medicaid HCBS Waiver (see Table 3).
States varied in the extent to which they provided family support services to children versus adults. In 2004, with 34 states reporting, 59% of families receiving family support services were providing care for a child with a developmental disability (generally states considered children to be 17 years of age or younger). This is slightly lower than the percentage reported in 1998, the last year in which data were collected. That year, with 35 states reporting, 65% of recipients of family support services were families of children below the age of 18.
An analysis of the 25 states that reported numbers of minor children and adult children receiving family support in both 1998 and 2004 was conducted. For these states, there was an overall increase in the number of families served between 1998 and 2004. However, this increase was not consistent across age of the family member with developmental disabilities. The number of families having adult children with developmental disabilities increased significantly (t24 = 2.45, p = 0.02) while the number of families with minor children with developmental disabilities remained about the same (t24 = 0.20, p = 0.84). The increase in the number of families receiving family support who had adult children with developmental disabilities was larger for states that had family support HCBS Waivers in 2004 (mean increase = 1,638 families with adults) than for states that had no family support HCBS Waiver (mean increase = 419 families with adults).
Family Support Initiatives Across the States
In 1998, the Administration on Developmental Disabilities (ADD), U.S. Department of Health & Human Services, began providing grants to the states to encourage innovation in family support initiatives. States used this funding to develop family support councils (7 states); conduct training and technical assistance activities (10 states); promote the integration and coordination of services to families (9 states); conduct outreach (2 states); promote the provision of culturally competent services (4 states); support aging caregivers (3 states); increase cash subsidy, voucher, and respite services (2 states); promote consumer and family-directed supports (5 states); and for policy development (6 states) (Parish, Pomeranz-Essley, & Braddock, 2003). Some states conducted more than one activity.
The most recent initiative by the ADD is the funding of multiple Family Support 360 grants. The goal of the Family Support 360 program is to develop family-driven, one-stop support centers targeting unserved or underserved populations. State developmental disabilities service systems often involve multiple state agencies with numerous points of entry. These one-stop family support centers are designed to foster interagency collaboration and efficiency and streamline family access to services. Since 2003, the ADD has provided funding for 21 Family Support 360 implementation grants and 9 Family Support 360 “planning” grants in the states (ADD, 2005a). Current implementation grants may offer family support navigators to help families find their way through the system, support groups, family advisory councils, resource centers, financial future planning, and parent training (ADD, 2005a; ADD, 2005b).
In 2004 the Centers for Medicare and Medicaid Services (CMS) awarded funding to 10 states to develop Family-to-Family Health Care Information and Education Centers. These family-led centers provide information and referral services, parent education, support groups, and information on the HCBS Waiver to families of children with special health care needs (“Family-to-Family Health Care,” 2005).
Family Support Legislation Across the States
Senator Hillary Rodham Clinton (D-NY) introduced a bill in the U.S. Senate in 2005 entitled the Lifespan Respite Care Act (S. 1283). This legislation proposed to provide competitive grant funding to states to increase access to affordable, quality respite services and increase awareness of the needs of caregivers. The Senate bill was referred to the Committee on Health, Education, Labor, and Pensions. A companion bill (H.R. 3248) was introduced in the House of Representatives by Representative Mike Ferguson (NJ-7) and was referred to the Subcommittee on Health.
Another potentially important piece of legislation is the Family Opportunity Act of 2005, also known as the “Dylan Lee James Act” (S. 622), which was re-introduced in Congress in January 2005 by Senators Edward Kennedy (D-MA) and Charles Grassley (R-IA). The bill allows states to create options for families with children who have disabilities to buy into Medicaid while continuing to work. There would be a new eligibility category for states to expand Medicaid coverage to children with disabilities up to age 18. The bill builds on previous reforms including the Balanced Budget Act of 1997 and the Ticket to Work and Work Incentives Improvement Act of 1999 (ADD, 2005a; ADD, 2005b).
Discussion and Recommendations
The modest increase in families supported from 2002 to 2004, and the decline in adjusted family support spending in 23 states, reflect the vulnerability of these flexible, community support programs in times of fiscal retrenchment (Braddock & Hemp, 2006). With state budgets strained, funding for family support, particularly funding for cash subsidy programs, often cannot compete with the financing of residential programs.
One important finding was variability in the level of HCBS Waiver funding for family support. Funding for cash subsidy programs constituted only 5% of total family support funding in 2004 and was almost exclusively financed with state dollars. Only a handful of federal programs, such as the Cash and Counseling Demonstration grants, allow states to utilize federal funding to provide direct payments to individuals with developmental disabilities. This has resulted in many states being reluctant to “Medicaid” their family support programs (Human Services Research Institute, 2004). States may also be financing cash subsidy programs at a lower rate due to fears of abuse or misuse by consumers and families. However, “overly restrictive measures…negate the effect of the consumer-directed intervention” (Simon-Rusinowitz, Mahoney, Shoop, Squillace, & Sowers, 2001, p.101).
Another issue of major concern in services for families is the availability of qualified respite workers. The Bureau of Labor Statistics (2001) projected a 63% increase in demand for direct support professionals in the disability field through the year 2010. This was more than twice the projected job demand increase for nursing aides, fast food workers, and for all occupations. “Vacancies are causing families with members who have intellectual or developmental disabilities in the family home to do without basic family support services (e.g., personal assistance, respite care) as available staff are first allocated to residential and vocational programs for which there are no alternative care providers” (Larson, Hewitt, & Lakin, 2004, p. 482). States will need to develop comprehensive respite programs that utilize family members, friends, and neighbors, and untapped populations such as retirees, to meet the rapidly increasing need for in-home supports. As Dan Winters, a member of the Illinois Council on Developmental Disabilities and the father of a son with developmental disabilities noted, “The problem isn’t only getting funding to pay for respite services, but finding someone I’d trust enough to leave my son with” (personal communication, September 15, 2005).
Over the past 30 years, funding from the Individuals with Disabilities Education Act (IDEA) and Medicaid has assisted many families to obtain the support needed to keep their children with ID/DD at home. The current generation of family caregivers expects more from the ID/DD long-term care system than the previous generation did. Policymakers must be prepared to address these substantially heightened expectations. Moreover, reliance on family caregiving is likely to increase in the future as states try to contain the rising costs of out-of-home placements (Braddock, 2002). The demand for family support services will also grow as a consequence of the increased number of aging caregivers. Family support has emerged as a fundamental consideration in ID/DD long-term-care policy.
References
Administration on Developmental Disabilities, U.S. Department of Health and Human Services. (2005a). “One-stop centers for families of individuals with developmental disabilities.” ADD Update, 6(2), 9-10.
Administration on Developmental Disabilities, U.S. Department of Health and Human Services. (2005b). “Wayne State University, Detroit, Michigan.” ADD Update, 6(2), 10.
Birenbaum, A., Guyot, D., & Cohen, H. J. (1993). On the importance of helping families: Policy implications from a national study. Mental Retardation, 31(2), 67-74.
Braddock, D. (Ed.). (2002). Disability at the dawn of the 21st century and the state of the states. Washington, DC: American Association on Mental Retardation.
Braddock, D., & Hemp. R. (2006). Growth of US public spending for intellectual/developmental disabilities slowed down 2002-04. Mental Retardation, 44(1), 77-80.
Braddock, D., Hemp, R., Fujiura, G. T., Bachelder, L., & Mitchell, D. (1990). The state of the states in developmental disabilities. Baltimore: Paul H. Brookes Publishing, Co.
Braddock, D., Hemp, R., & Rizzolo, M.C. (2004). State of the states in developmental disabilities: 2004. Mental Retardation, 42(5), 356-370.
Braddock, D., Hemp, R., Rizzolo, M. C., Coulter, D., Haffer, L., & Thompson, M. (2005). The state of the states in developmental disabilities. Boulder, CO: The Coleman Institute for Cognitive Disabilities and Department of Psychiatry, University of Colorado.
Caldwell, J., & Heller, T. (2003). Management of respite and personal assistance services in a consumer-directed family support programme. Journal of Intellectual Disability Research, 47(4/5), 352-366.
“Family-to-Family Health Care Information and Education Centers.” (2005, August). Perspectives 11(8), 12-16.
Fujiura, G. T. (1998). Demography of family households. American Journal on Mental Retardation, 103(3), 225–235.
Fujiura, G. T., Roccoforte, J. A., & Braddock, D. (1994). Costs of family care for adults with mental retardation and related developmental disabilities. American Journal on Mental Retardation, 99(3), 250-261.
Heller T., Miller A. B., & Hsieh, K. (1999). Impact of a consumer-directed family support program on adults with disabilities. Family Relations, 48, 419-427.
Herman, S. E. (1991). Use and impact of a cash subsidy program. Mental Retardation, 29, 253-258.
Human Services Research Institute (October 14, 2004). Family support conference call.
Johnson, C. P., Kastner, T. A., & The Committee/Section on Children with Disabilities. Helping families raise children with special health care needs at home. Pediatrics, 115(2), 507-511.
Larson, S. A., Hewitt, A. S., & Lakin, K. C. (2004). Multiperspective analysis of workforce challenges and their effects on consumer and family quality of life. American Journal on Mental Retardation, 109(6), 481-500.
Larson, S. A., Lakin, K. C., Anderson, L., Kwak, N., Lee, J. H., & Anderson, D. (2000). Prevalence of mental retardation and/or developmental disabilities: Analysis of the 1994/1995 NHIS-D. MR/DD Data Brief, 2(1). [Minneapolis, MN: University of Minnesota, Institute on Community Integration, Research and Training Center on Community Living.]
Meyers, J. C. & Marcenko, M. O. (1989). Impact of a cash subsidy program for families of children with severe developmental disabilities. Mental Retardation, 27, 383-387.
Parish, S. L., Pomeranz-Essley, A., & Braddock, D. (2003). Family support in the United States: Financing trends and emerging initiatives. Mental Retardation, 41(3), 174-187.
Rizzolo, M. C., Hemp, R., Braddock, D., & Pomeranz-Essley, A. (2004). The state of the states in developmental disabilities: 2004. Boulder, CO: The Coleman Institute for Cognitive Disabilities and Department of Psychiatry, University of Colorado.
Rothman, D. J. (1971). The discovery of the asylum: Social order and disorder in the New Republic. Boston: Little, Brown and Company.
Simon-Rusinowitz, L., Mahoney, K. J., Shoop, D. M., Desmond, S. M., Squillace, M. R., & Sowers, J. A. (2001). Consumer and surrogate preferences for a cash option versus traditional services: Florida adults with developmental disabilities. Mental Retardation, 39(2), 87-103.
Turnbull, H. R., & Turnbull, A. P. (2000). Family support: Retrospective and prospective. In M. L. Wehmeyer & J. R. Patton (Eds.), Mental retardation in the 21st century (pp. 3–17). Austin, TX: Pro-Ed.
Zimmerman, S. L. (1984). The mental retardation family subsidy program: Its effect on families with a mentally handicapped child. Family Relations 33, 105-118.
Other Institute Resources of Interest
The publications below are available on the Web and/or in print. For information on ordering print copies, please call (612) 624-4512 or e-mail icipub@umn.edu.
Impact: Feature Issue on Consumer-Controlled Budgets and Persons With Disabilities. (2004). This issue of Impact focuses on various aspects of and experiences with self-directed supports and individually managed budgets. It includes articles from policy, service, and individual/family perspectives illustrating what is possible when self-determination guides service provision. Cost: First copy is free; each additional copy is $4.00. Also published online at http://ici.umn.edu/products/newsletters.html#various.
Impact: Feature Issue on Support Coordination and Self-Determination for Persons With Developmental Disabilities. (1999/2000). This issue of Impact explores support coordination and the role of those who assist people with disabilities and their families to access the full range of service and support options; make decisions that support their values, goals, and needs; and more directly control their own lives. Cost: First copy is free; each additional copy is $4.00.
Impact: Feature Issue on Supporting Parents Who Have Cognitive Limitations. (1998). This issue of Impact examines strategies for supporting persons with cognitive limitations to be successful in raising their children in safe, healthy, loving and stimulating environments. Cost: First copy is free; each additional copy is $4.00.
DD Data Brief: Mothers With Disabilities – Characteristics and Outcomes: An Analysis From the 1994/1995 NHIS-D. (2005). The DD Data Brief series summarizes findings from the National Health Interview Survey Disability Supplement (NHIS-D) conducted by the U.S. Bureau of the Census, National Center on Health Statistics in 1994 and 1995. This DD Data Brief examines the characteristics of mothers with intellectual and/or developmental disabilities (ID/DD) and their children, estimates the number of mothers with ID/DD in the U.S. non-institutionalized population, and examines factors that influence developmental outcomes for both mothers with disabilities and their children.
DD Data Brief: Children With Disabilities: Social Roles and Family Impacts. (2002). This issue of DD Data Brief uses the 1994-1995 Child Disability Follow-Back Survey of the National Health Interview Survey to examine the characteristics of children between the ages of 6 and 17 who were identified as having functional limitations or a disability-related diagnosis. Four disability groups were defined and described in terms of their ability to perform the social roles expected of children (e.g., relationships with family and friends, participation in school and other activities).
MR/DD Data Brief: Characteristics of and Service Use by Persons With MR/DD Living in Their Own Homes or With Family Members. (2001). This issue of MR/DD Data Brief uses the NHIS-D to describe people with MR/DD living in the community in terms of basic demographic characteristics, functional and other limitations, residential services history, medical services received, social activities, transportation used, and waiting list status, and compares people with and without MR/DD in regard to health status and service, functional limitations, major activity status, and school status.
Residential Services for Persons With Developmental Disabilities: Status and Trends Through 2004. (2005). This report provides statistics by state for the fiscal year ending June 30, 2004, and long-term trends, for residential services, settings, populations and expenditures for persons with developmental disabilities in state, nonstate and Medicaid-funded residential programs in the U.S. Resident characteristics, movement and staffing patterns in large state residential facilities are included. Available online at http://rtc.umn.edu/risp. To request a free print copy, contact Bob Prouty at (612) 626-2020 or prout004@umn.edu.
This issue was supported, in part, by Cooperative Agreement #H133B031116 from the National Institute on Disability and Rehabilitation Research (NIDRR), U.S. Department of Education.
Managing Editor is Sheryl A. Larson. The opinions expressed here are those of the authors and do not necessarily reflect the position of the Center or its funding sources.
Print copies of this publication are available for $3.00 per copy. An order form is available online, or contact:
Publications Office Institute on Community Integration University of Minnesota 109 Pattee Hall, 150 Pillsbury Drive SE Minneapolis, MN 55455 612 / 624-4512
Policy Research Brief is available in alternative formats upon request from the above address.
![]()
The University of Minnesota is an equal opportunity employer and educator.
Published on the Web site of the Institute on Community Integration, University of Minnesota (http://ici.umn.edu)